Initiating coverage | Infrastructure
January 23, 2015
MBL Infrastructures
BUY
CMP
`442
Gearing-up for next level of growth
Target Price
`561
Strong Order inflows to lead to better execution: MBL Infrastructures (MBL), a
Investment Period
12 Months
specialist EPC player is expected to benefit from NHAI’s ~2,000km of EPC award
activity in the next 12 months. With economic revival, infra award activity across
verticals should catch-up. MBL has participated in projects worth `10,000cr.
Stock Info
Going by its past track record, of ~25% strike rate, MBL should report ~`2,500cr
Sector
Infrastructure
worth of new project wins in the next 12 months. We expect MBL’s order inflow to
Market Cap (` cr)
916
report ~13% CAGR over FY2014-17E, which is likely to be followed-up by
Net debt (` cr)
704
stronger execution. Accordingly, we expect MBL’s standalone entity to report a
strong ~18% top-line CAGR during FY2014-17E.
Beta
1.3
52 Week High / Low
464/100
~16% PAT CAGR during FY2014-17E: Stronger execution, benefits of backward
integration and better absorption of fixed costs, should help the standalone entity
Avg. Daily Volume
14,819
report a ~22% EBITDA CAGR during FY2014-17E (EBITDA margin to expand
Face Value (`)
10
107bp during the same period). Despite a strong EBITDA growth, higher interest
BSE Sensex
29,279
and depreciation expenses would restrict standalone PAT at ~16% CAGR during
Nifty
8,836
the same period, as per our estimation.
Reuters Code
MBLI.BO
BOT projects nearing completion: MBL has a portfolio of 5 BOT Road projects, of
Bloomberg Code
MBL@IN
which 4 are won on “Toll+Grant” or “Toll+Annuity” model. This, when coupled
with the fact that 4 of these projects are in the mineral belt region and are inter-
connected with no alternate roads, indicates that these projects could generate
impressive equity IRRs. With commencement of 4 BOT projects in FY2016-17, we
Shareholding Pattern (%)
can expect a possible easing in the balance sheet stress.
Promoters
46.7
Comfortable Balance Sheet: MBL is one of the Road developers with moderate
MF / Banks / Indian Fls
29.6
consol. D/E ratio of 1.8x. With 3 BOT projects nearing completion (to commence
FII / NRIs / OCBs
5.7
tolling in FY2016E) and 4th to commence operations in FY2017E, we expect
Indian Public / Others
18.1
consol. D/E ratio to increase to 2.7x by FY2017E. With Management clarifying
that it does not intend to add any new BOT projects to company’s portfolio till
FY2017E, we are confident that MBL’s D/E ratio would peak at 2.7x, which is
comforting.
Abs. (%)
3m 1yr 3yr
Sensex
9.4
38.5
72.3
Valuation: At CMP of `442/share, MBL is trading at FY2016E and FY2017E
EV/EBITDA multiple of 9.1x and 7.0x, respectively. Improved order inflow outlook
MBL
37.6
272.5
198.7
(with current bid pipeline of ~`10,000cr), strong profitability growth, and a
comfortable Balance Sheet strengthen our view that MBL is poised for re-rating
from here-on. We value BOT projects using PV of Free Cash Flows to Equity
shareholders to arrive at a value of `105/share (for all 5 of the BOT projects). We
have assigned 8.0x target P/E multiple to the standalone business to arrive at a
value of `456/share. On adding-up value of standalone entity and BOT projects,
we arrive at FY2017E sum-of-the-parts (SoTP) based price target of `561/share.
Given the 27% upside from the current levels, we initiate coverage on MBL
Infrastructures with a BUY rating.
Key Financials (Standalone)
Y/E March (` cr)
FY2013
FY2014
FY2015E
FY2016E
FY2017E
Net Sales
1,343
1,754
2,019
2,453
2,857
% chg
30.6
15.1
21.5
16.5
Net Profit
55
75
85
100
118
% chg
35.8
12.9
18.4
17.6
EBITDA (%)
9.8
10.0
10.5
10.9
11.1
EPS (`)
32
43
41
48
57
P/E (x)
14.0
10.3
10.8
9.1
7.8
P/BV (x)
2.0
1.7
1.4
1.2
1.1
RoE (%)
15.1
17.6
15.2
14.4
14.8
RoCE (%)
16.6
19.3
17.5
16.5
16.5
Yellapu Santosh
EV/Sales (x)
0.9
0.7
0.8
0.7
0.7
022 - 3935 7800 Ext: 6828
EV/EBITDA (x)
9.2
7.0
7.5
6.8
6.0
Source: Company, Angel Research
Please refer to important disclosures at the end of this report
1
Initiating coverage | MBL Infrastructure
Investment Argument
Order Inflow outlook improves, gives better revenue
visibility
In a poor award activity environment during FY2010-14, captive orders from BOT
projects helped MBL clock a 36% CAGR in its order inflows. Taking into account
the new government’s thrust on the Infra sector, and with economic indicators
showing signs of revival; we expect revival across Infra award environment to
catch-up from here on.
Post amendments to the Land Acquisition Law, NHAI is gearing up to have a
strong award activity in 4QFY2015E-FY2016E. We expect NHAI to award
~4,000km of road projects in the next 12 months. Of these, ~2,000km would be
through the EPC route. With MBL’s Management clarifying that the company would
not be bidding for BOT projects, it can be estimated on this basis that MBL would
only bid for ~2,000km of EPC road projects.
The Management also highlighted that the company has bid for projects worth
~`10,000cr, which are currently at different bidding stages. If we look at the last
5 years’ historical win rate of 20-40%, coupled with slightly lower bidding intensity,
we are comforted that MBL is likely to report ~`2,500cr (indicating 25% strike rate
assumption) worth of project wins in the next 12 months.
Our order inflow growth assumption captures (1) resumption in award activity from
State PWDs/ NHAI Road projects, (2) award activity from DFC (Dedicated Freight
Corridor) space, and
(3) uptick in award activity from Metro, Industrial
Construction as well as Building & Housing Construction space. Accordingly, we
expect ~13% CAGR in MBL’s order inflows during FY2014-17E.
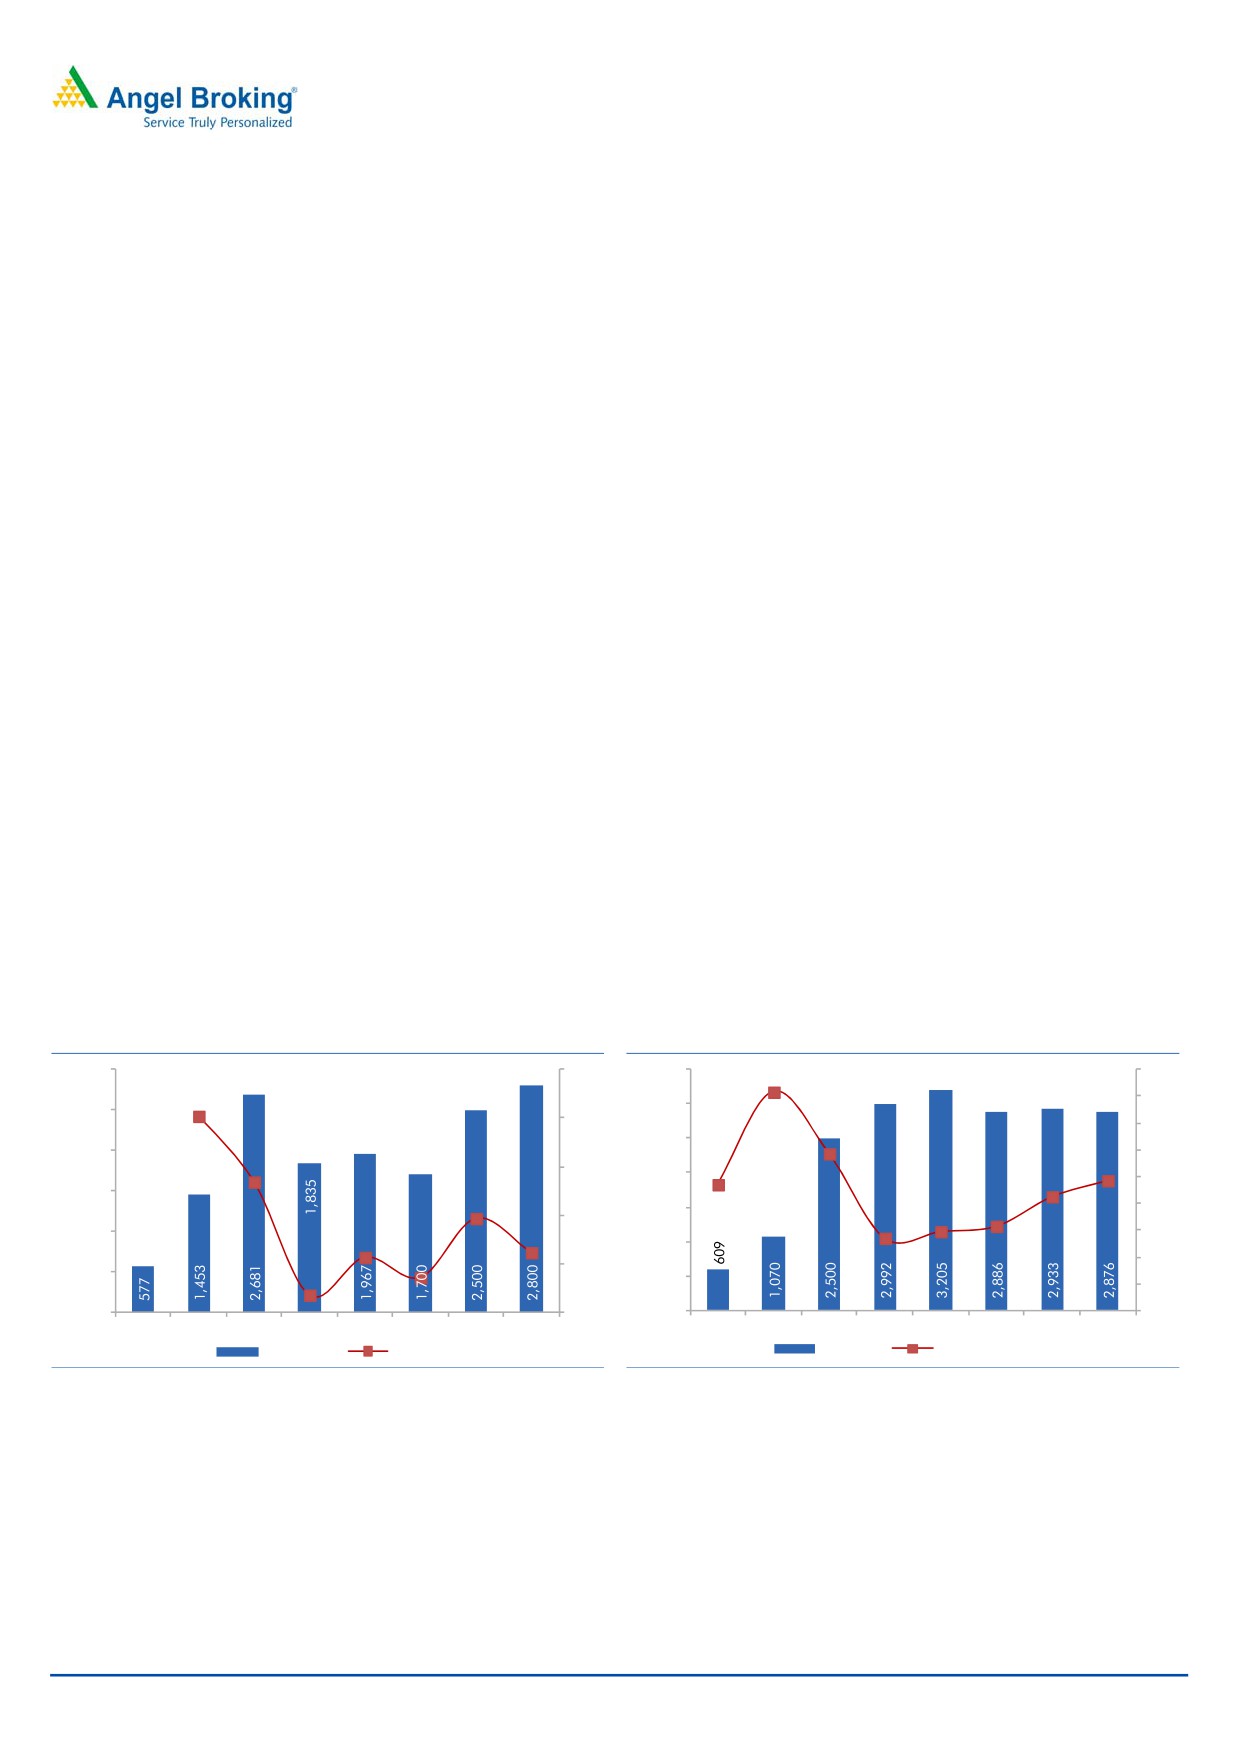
Exhibit 1: Order Inflow to catch-up
Exhibit 2: Execution to pick-up
3,000
200
3,500
1.8x
1.6x
1.6x
3,000
2,500
152
150
1.4x
2,500
2,000
1.2x
1.2x
100
2,000
1.0x
84
1.0x
1,500
0.9x
1,500
0.9x
0.8x
47
50
0.6x
1,000
0.6x
0.6x
1,000
0.5x
7
12
0.4x
0
500
(14)
500
0.2x
(32)
0
-50
0
0.0x
FY10
FY11
FY12
FY13
FY14
FY15E FY16E FY17E
FY10
FY11
FY12
FY13
FY14
FY15E FY16E FY17E
OI (` cr)
y/y change (%)
OB (` cr)
Execution Rate (x)
Source: Company, Angel Research
Source: Company, Angel Research
MBL’s unexecuted order book (as of 2QFY2015-end) stands at `2,354cr, thereby
giving revenue visibility for another 4-5 quarters. As against the Management’s
guidance of an order book of over `3,500cr by 4QFY2015-end, we expect MBL to
end with an order book of `2,886cr. Our lower OB assumption for FY2015 is
owing to expectation of just `1,700cr of OI for FY2015 (to-date, publicly reported
OI of `860cr). However, with order inflow momentum likely to catch-up from
here-on, we expect MBL to also experience strong uptick in execution (execution
rate would pick-up from 0.6x in FY2014 to 1.0x by FY2017E).
January 23, 2015
2
Initiating coverage | MBL Infrastructure
BOT projects to start paying-off
Currently, only 1 of the 5 BOT Road projects owned by MBL is operational. The
remaining 4 projects are likely to commence operations in FY2016-17E. 3 of the
4 ongoing projects are nearing completion (entire land acquisition is complete,
and majority of equity infusion is done), indicating minimal execution risks from
here-on. These 3 BOT projects are likely to attain Commercial Operations Date
(CoD) over the next 2-4 quarters.
Exhibit 3: BOT Projects Net Total Income (in ` cr)
FY14
FY15E
FY16E
FY17E
Seoni-Balaghat-Rajegaon BOT project
17
19
21
23
Waraseoni-Lalbarra BOT project
0
0
8
12
Garra-Waraseoni BOT project
0
0
14
23
Seoni-Katangi BOT project
0
0
11
22
Suratgarh-Bikaner BOT project
0
0
0
50
BOT Projects - Net Total Income
17
19
54
130
Source: Company, Angel Research
Given that the ongoing EPC work at Suratgarh-Bikaner BOT project is slow and
behind schedule (~20% of total EPC work is done), we expect this project to attain
CoD in 2HFY2017E.
AAP Infrastructures Ltd (Seoni-Balaghat-Gondia stretch), the company’s only
operational BOT project, has been profitable since FY2010 (incurred losses during
FY2008-09). Notably,
2 of the
4 BOT projects have been bagged under
Toll+ Annuity model and another 2 have been bagged on a grant model. We are
impressed with Management’s business acumen, as MBL is likely to generate
Future Cash flows of 0.4x-2.5x for the equity invested. MBL’s cautious strategy
impresses us as in our view, we expect MBL to generate impressive Equity IRRs in
the range of
15-18% (for
3 of the upcoming BOT projects). Whereas,
Garra-Waraseoni project in our view is likely to generate just 6% equity IRR.
We expect MBL’s Net Total Income from BOT projects to increase from `17cr in
FY2014 to `130cr in FY2017E (95% CAGR during FY2014-17E). Also, with the
commencement of tolling across 4 BOT projects, we expect the debt repayment
cycle of these SPVs to commence, thereby easing consol. balance sheet stress.
~18% & ~16% Revenue & PAT CAGR, respectively, during FY14-17E
On the back of a strong ~13% CAGR in Order Inflows during FY2014-17E, we
expect execution also to pick. Accordingly, we expect the standalone business to
report ~18% revenue CAGR during FY2014-17E to `2,857cr.
Revenue growth should help MBL absorb fixed costs, leading to EBITDA growth.
Our 22% EBITDA CAGR estimate during FY2014-17E is on the back of following
levers, (1) benefits from their in-house Ready-To-Mix concrete (RMCs), (2) access to
6 quarrying facilities, (3) higher utilization of in-house Construction Equipment
(current Plant & Machinery [P&M] Gross block stands at `200cr), and (4) better
absorption of fixed costs. Despite commencement of interest rate down-cycle, we
do not expect entire benefits of EBITDA growth to flow-down to the PAT level. We
expect interest and depreciation expenses to restrict PAT CAGR during FY2014-17E
to ~16%.
January 23, 2015
3
Initiating coverage | MBL Infrastructure
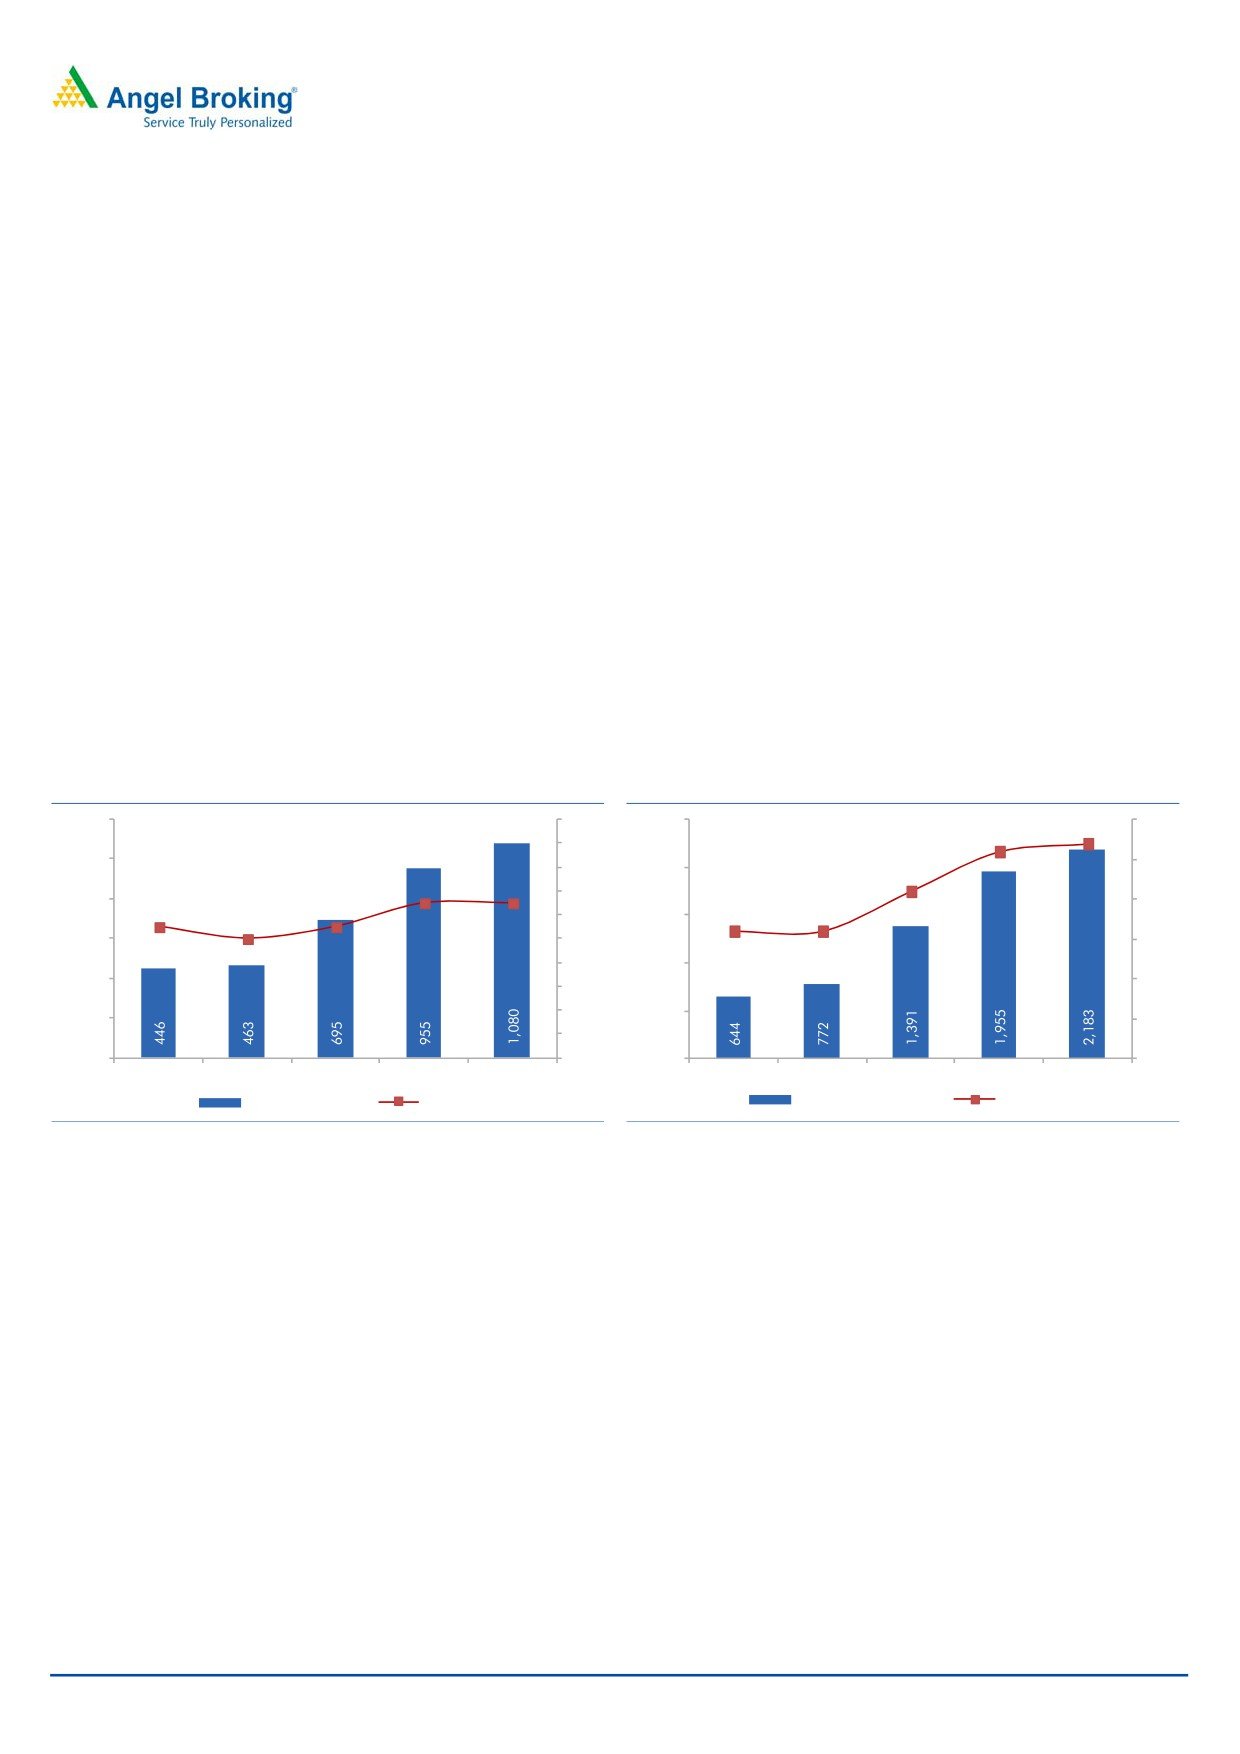
Comfortable Gearing ratio
MBL has been prudent in managing its capital requirements. Considering
standalone entity’s D/E ratio (of ~1.0x) and standalone entity’s potential to
generate over `100cr of Cash Flow from Operations during FY2014-17E, we are
not much concerned about the gearing ratio at standalone entity level.
MBL’s selective strategy to bid for and win new BOT projects at the right time has
helped the company in managing its capital efficiently. This could be gauged from
their consol. D/E ratio, which at 2QFY2015-end stood at 1.8x.
As a prudent move, in anticipation of improvement in business cycle, MBL recently
pursued a Qualified Institutional Placement (QIP) issue (issued 3.2mn additional
shares @`365/share, thereby raising ~`110cr). 4 of the ongoing BOT projects
require equity investments of ~`87cr. With MBL’s Management clarifying that it
would not bid for BOT Road projects till FY2017E, idly lying cash and internal
accruals should be enough to fund the equity requirements of these 4 BOT
projects. Also, by raising equity, MBL has built-up its war chest for the next phase
of growth. On the whole, we expect consol. gearing ratio to increase to 2.7x by
FY2017E, which is in a comfortable zone.
Exhibit 4: Standalone D/E ratio
Exhibit 5: Consolidated D/E ratio
1,200
2.0x
2,500
3.0x
2.7x
1.8x
2.6x
1,000
2.5x
1.6x
2,000
1.3x
1.4x
2.1x
800
1.3x
2.0x
1.2x
1,500
1.1x
1.6x
1.1x
1.0x
1.6x
600
1.0x
1.5x
0.8x
1,000
400
1.0x
0.6x
0.4x
500
200
0.5x
0.2x
0
0.0x
0
0.0x
FY13
FY14
FY15E
FY16E
FY17E
FY13
FY14
FY15E
FY16E
FY17E
Std. Debt (` cr)
D/E ratio (x)
Consol. Debt (` cr)
D/E ratio (x)
Source: Company, Angel Research
Source: Company, Angel Research
Selective bidding, best approach to grow Order Book
MBL, over the years, has shown immense maturity in bidding for the right kind of
projects and working for clients who are quality conscious. It bids for projects,
which are funded either by government agencies or international bodies such as
World Bank and ADB. This strategy mitigates payment default risk and helps
maintain WC levels prudently.
When the entire industry was witnessing heated competition and experiencing
higher D/E ratios (on account of higher exposure to BOT road projects), MBL
stayed away from the BOT space. It was only after competition started easing-off
that MBL entered the BOT Road space. This strategy helped them bid for projects
in a lesser competitive environment and sign the projects with attractive terms.
Given that 2 of MBL’s projects are on Toll+ Annuity and another 2 on Toll+ Grant
model, we are optimistic of the company experiencing impressive equity IRR across
these projects. This strategy has also helped MBL in building its order book in a
down-cycle, when the award activity witnessed severe slowdown. It is this business
January 23, 2015
4
Initiating coverage | MBL Infrastructure
prudence, which helped MBL cover its fixed costs base in a down-cycle and
maintain ~10% standalone EBITDA levels.
Notably, all projects of MBL have a price pass-on clause in-built, thereby insulating
the company from any sharp fall in EBITDA margins.
All the above-mentioned initiatives and well timed strategic moves have helped
MBL maintain ~10% EBITDA margins during FY2010-14 and generate Cash flow
from Operations to the tune of ~`176cr during FY2012-14.
Backward integration to aid in quicker margin expansion
MBL over the years has invested in (1) Ready-to-Mix Concrete (RMC) plants,
(2)
6 quarrying facilities strategically located across North & Eastern India and
(3) wide array of Construction Equipments. This strategy to invest in resources
would help the company in ensuring quick and timely supply of stone aggregates
at the project location, thus translating into cost savings. In an up-cycle, where
award activity is likely to see a sharp bounce back, we expect having large
inventory of construction equipments would help MBL in lowering execution costs;
reduce mobilization time, thereby translating to higher operating margins. All
these backward integration initiatives should help the standalone entity in reporting
a 107bp EBITDA margin expansion during FY2014-17E to 11.1%.
January 23, 2015
5
Initiating coverage | MBL Infrastructure
Update on BOT Projects
MBL has a portfolio of 5 BOT Road projects, of which only 1 is operational
(Seoni-Balaghat-Gondia). MBL’s Management has guided that all 4 BOT road
projects would be operational in FY2016E (vs. our assumption of only 3 being
operational in FY2016E). By 2QFY2015-end, MBL had already invested `201cr of
the total required `288cr, implying that `87cr further needs to be invested towards
these 4 BOT projects. ~`110cr raised from the QIP issue and internal accruals
should help MBL meet the remaining equity requirement of `87cr.
Exhibit 6: Details of BOT Projects
Particulars
AAPIL
MHDCL
MPTRCL
MPRNCL
SBTRCL
Seoni-Balaghat-
Waraseoni-
Garra-
Stretch
Seoni-Katangi
Bikaner-Suratgarh
Gondia
Lalbarra Road
Waraseoni
Project Type
BOT- Toll
BOT- Toll
BOT- Toll+Annuity
BOT- Toll+Annuity
BOT- Toll
State
Madhya Pradesh
Maharashtra
Madhya Pradesh
Madhya Pradesh
Rajasthan
Length (kms)
114
76
18
47
172
Status
Operational
Under Construction Under Construction Under Construction Under Construction
Concession Period
15 years
30 years
15 years
15 years
16 years
MBL's stake
100%
100%
100%
100%
65%
Concession Agreement Date
Mar-05
Sep-11
Dec-11
Mar-13
Dec-11
TPC (` in cr)
108
212
57
137
620
EPC (` in cr)
91
177
47
110
510
Debt (` in cr)
61
101
42
97
450
Equity (` in cr)
12
51
15
40
170
Grant (` in cr)
35
60
0
0
0
Traffic Growth Assumption:
1-5 years
5%
5%
5%
5%
6-16 years
5%
3%
3%
3%
3%
16 years and there-after
0%
NA
NA
NA
Equity IRR (%)
15%
16%
6%
18%
Source: Company, Angel Research; Note: NA- Not Applicable
MBL’s Management maintained that they have strategically bid for road projects in
mineral rich regions, which also happen to be important hubs and presently do not
have any other alternative connecting roads. Notably, 4 of the 5 BOT road
projects are inter-connected namely, Seoni- Balaghat-Gondia, Seoni-Katangi to
Maharashtra Border, Waraseoni-Lalbarra and Garra-Waraseoni stretches.
Accordingly, MBL’s Management claims to have 2 stretches of BOT projects. One
of the stretches is on NH-15 across Suratgarh-Bikaner (connecting north India to
Samakhiali, Gujarat) and other one is a stretch across NH-6/7 in Madhya
Pradesh.
January 23, 2015
6
Initiating coverage | MBL Infrastructure
Consolidated Financials
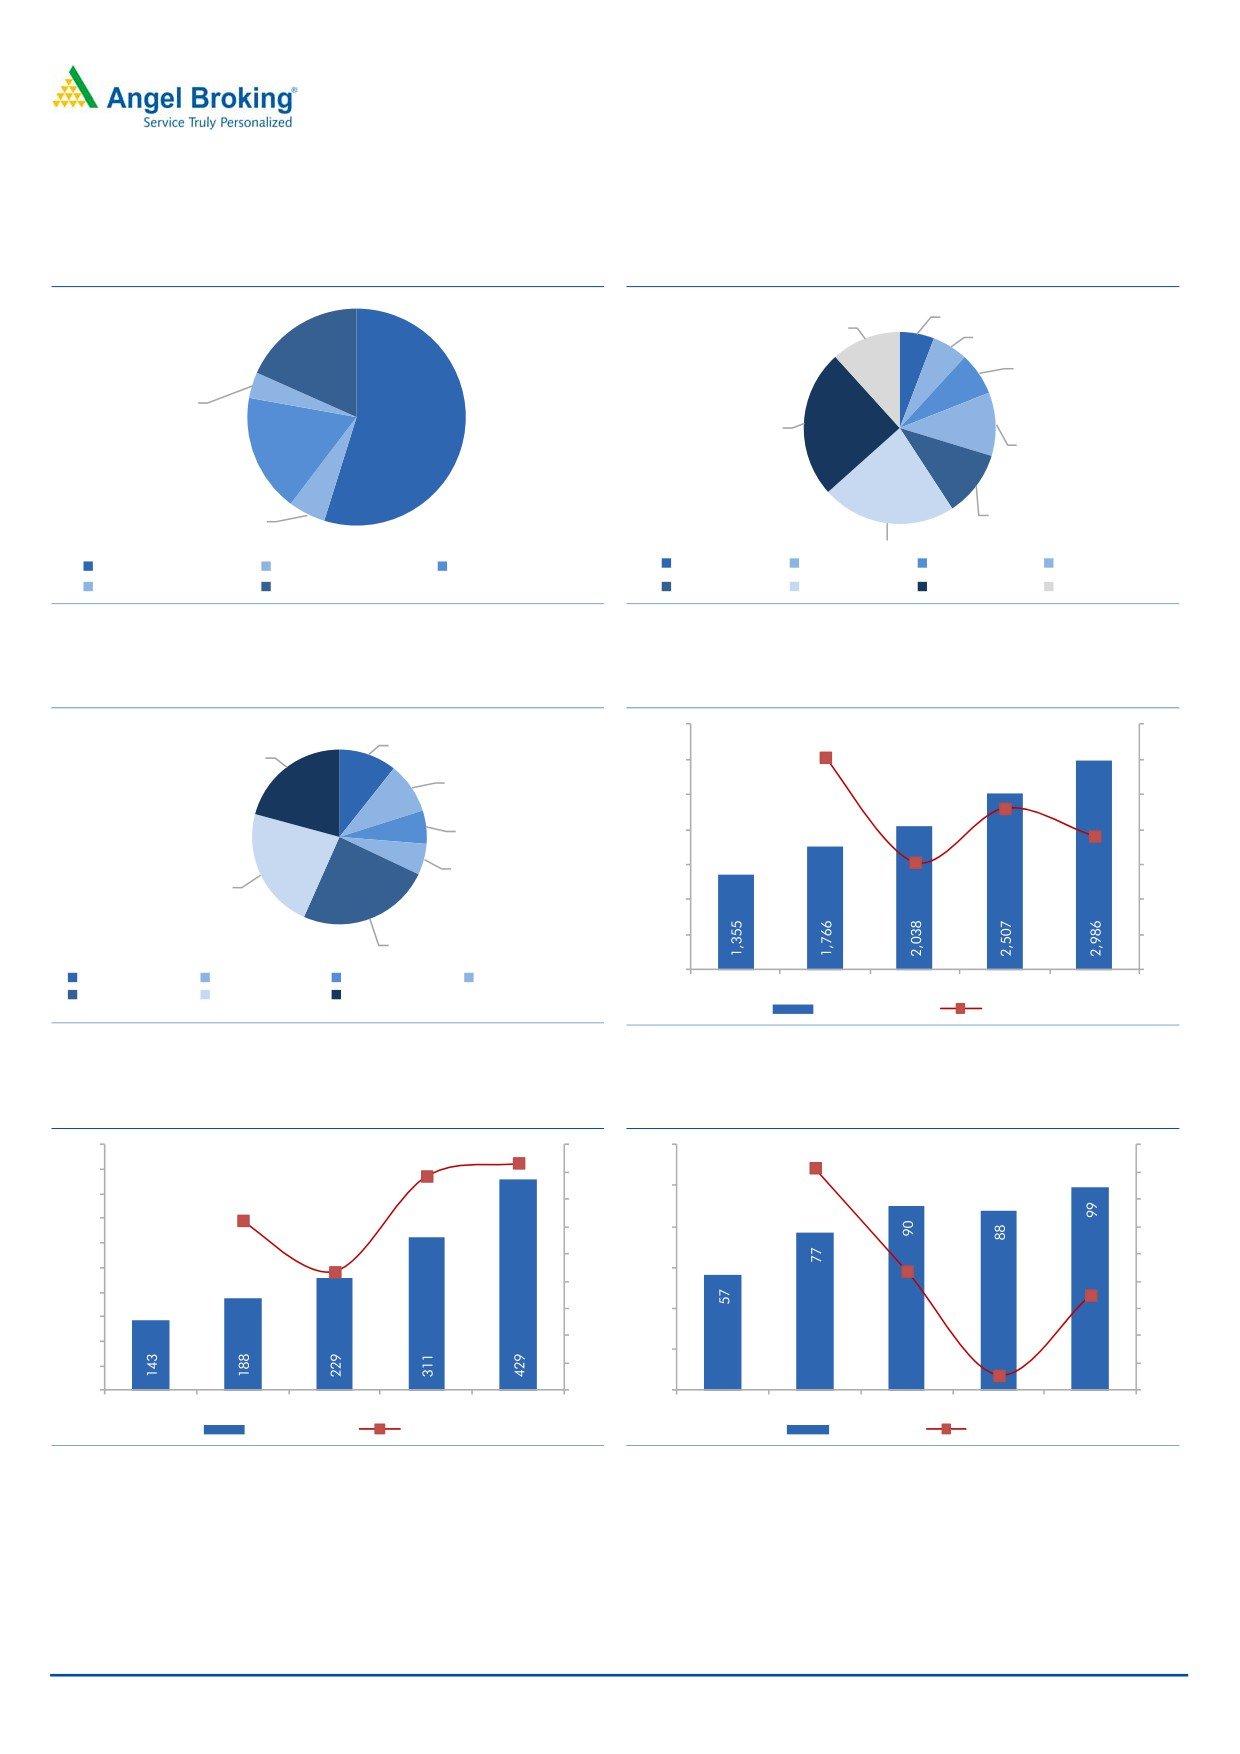
MBL reported an impressive 29% top-line CAGR during FY2010-14 to `1,766cr.
This top-line growth reflects (1) ~51% order book CAGR during the same period,
and (2) ~21% Toll Income CAGR during same period (for their only operational
BOT- Seoni-Balaghat-Rajegaon stretch). At 2QFY2015E-end, MBL’s unexecuted
order book stood at `2,354cr, thereby giving revenue visibility for another
4-5 quarters. For 1HFY2015E, MBL reported a 14.0% yoy top-line growth (to
`864cr). With uptick in order book and commencement of 4 BOT road projects,
we expect MBL to report a 19% top-line CAGR during FY2014-17E.
Exhibit 7: Consol. Revenue split
FY14-17E
Particulars (` cr)
FY14
FY15E FY16E
FY17E
CAGR (%)
Consolidated Revenues
1,766
2,038
2,507
2,986
19
Standalone Revenues
1,749
2,019
2,453
2,857
18
Revenues from BOT Projects
17
19
54
130
95
Seoni-Balaghat-Rajegaon BOT project
17
19
21
23
10
Waraseoni-Lalbarra BOT project
0
0
8
12
n/a
Garra-Waraseoni BOT project
0
0
14
23
n/a
Seoni-Katangi BOT project
0
0
11
22
n/a
Suratgarh-Bikaner BOT project
0
0
0
50
n/a
Source: Company, Angel Research; Note: n/a- Not Applicable
Despite a challenging macro environment, EPC business’ dependency on captive
BOT projects helped the company maintain its EBITDA margins at over 10% levels.
During FY2010-14, MBL reported an impressive 19.6% EBITDA CAGR (to `188cr).
With 4 of the BOT projects (have higher EBITDA margins vs. EPC business) likely to
commence operations in FY2016-17, coupled with (1) efficiencies from their
backward integration initiatives, and (2) new project wins on low bidding intensity,
we can expect MBL to report sharp EBITDA growth during FY2014-17E (we have
modeled ~32% CAGR over FY2014-17E). In other words, we expect EBITDA
margins to expand by 372bp during FY2014-17E to 14.4%.
Exhibit 8: Consol. EBITDA split
FY14-17E
Particulars (` cr)
FY14
FY15E FY16E FY17E
CAGR (%)
Consolidated EBITDA
188
229
311
429
32
Standalone EBITDA
176
212
267
317
22
BOT Projects EBITDA
12
17
44
112
111
Source: Company, Angel Research
During FY2010-14, MBL reported a restricted PAT CAGR of ~9%, reflecting the
impact of higher interest and depreciation expenses (partly owing to their
Seoni-Balaghat-Rajegaon BOT project). 4 of the BOT projects are expected to
commence operations in FY2016-17E. We do not expect the entire benefits of
EBITDA growth to flow down to the PAT level, as interest and depreciation
expenses would also increase. Accordingly, we expect MBL to report ~9% PAT
CAGR during FY2014-17E. In other words, PAT margins would decline from 4.4%
in FY2014 to 3.3% by FY2017E.
January 23, 2015
7
Initiating coverage | MBL Infrastructure
Exhibit 9: Consol. PAT split
FY14-17E
Particulars (` cr)
FY14A
FY15E
FY16E
FY17E
CAGR (%)
Consolidated PAT
77
90
88
99
9
Standalone PAT
75
85
100
118
16
BOT Projects PAT
2
5
(12)
(19)
NA
Source: Company, Angel Research; Note: NA - Not applicable
Capital deployment towards BOT projects, which report losses in first 1-2 years,
should be a drag on overall return ratios of the company. Accordingly, we expect
consol. Return on Capital Employed (RoCE) and Return on Equity (RoE) ratios to
decline from ~16%/18% in FY2014 to ~13%/13% in FY2017E.
Exhibit 10: Consolidated RoCE (%)
Exhibit 11: Consolidated RoE (%)
18
20
16
18
14
16
14
12
12
10
10
8
8
6
6
4
4
2
2
0
0
FY13
FY14
FY15E
FY16E
FY17E
FY13
FY14
FY15E
FY16E
FY17E
Source: Company, Angel Research
Source: Company, Angel Research
January 23, 2015
8
Initiating coverage | MBL Infrastructure
Valuation
We have valued MBL using Sum-Of-The-Parts method. MBL’s EPC business (under
standalone entity) has been valued using FY2017E P/E multiple, whereas BOT
projects are valued using the “Free Cash flow to Equity holders” method.
Value of Core EPC business
The standalone EPC business is trading at FY2016E and FY2017E P/E multiple of
9.1x and 7.8x, respectively. Standalone entity EPC is trading at ~25% discount to
its peers’ average (include- Simplex Infra, Ahluwalia Contracts, KNR Construction
and J Kumar Infra). This discount could be attributable to (1) MBL’s lower RoE of
14.8% for FY2017E vs. peers’ average of 16.3% in FY2017E), and (2) higher
dependency on only one vertical, i.e. the Roads Vertical (a/c’s for ~73% of
unexecuted order book).
Exhibit 12: Peer Group comparison (Standalone numbers)
Revenues (` cr)
EBITDA Margins (%)
PAT Margins (%)
Rev. CAGR
PAT CAGR
Particulars
FY14
FY15
FY16
FY17
FY15E FY16E FY17E FY15E FY16E FY17E
FY2014-17E(%)
FY2014-17E(%)
MBL Infra
1,754
2,019
2,453
2,857
10.5
10.9
11.1
4.2
4.1
4.1
17.7
16.3
Simplex Infra
5,499
5,696
6,472
7,670
10.7
10.8
10.4
1.2
1.8
2.6
11.7
49.4
KNR Construction
837
886
1,059
1,336
15.4
15.5
14.7
7.1
7.3
7.3
16.9
17.2
Ahluwalia Contracts
957
1,155
1,408
1,692
10.3
11.0
11.9
5.7
6.2
7.0
20.9
76.0
J Kumar Infra
1,169
1,456
1,774
2,191
17.5
17.3
16.8
6.9
7.4
7.6
23.3
25.9
Average
13.5
13.7
13.5
5.2
5.7
6.2
18.2
42.1
Source: Bloomberg estimates, Company, Angel Research
Exhibit 13: Peer Group comparison (Standalone numbers)
M-Cap
RoE (%)
EPS (`)
Adj. P/E (x)
CMP
(` cr)
FY14
FY15
FY16
FY17
FY15E
FY16E
FY17E
FY15E
FY16E
FY17E
MBL Infra
442
916
17.6
15.2
14.4
14.8
40.9
48.5
57.0
10.7
9.0
7.7
Simplex Infra
366
1,812
4.5
4.9
7.8
12.1
13.9
24.1
41.7
26.3
15.2
8.8
KNR Construction
378
1,055
4.5
4.9
7.8
12.1
22.3
27.5
34.9
16.8
13.6
10.8
Ahluwalia Contracts
243
1,626
10.1
23.1
23.2
24.4
10.1
13.4
17.9
24.1
18.1
13.5
J Kumar Infra
476
1,535
15.6
14.9
16.0
16.8
31.9
41.6
52.0
14.9
11.4
9.2
Average
8.7
12.0
13.7
16.3
20.5
14.6
10.6
Source: Bloomberg estimates, Company, Angel Research
We have valued MBL’s core EPC business (standalone entity) based on P/E multiple
and assigned 8.0x for FY2017E EPS of `57, resulting in value of `456 per share.
Value of BOT projects
BOT projects have been valued using the “Free Cash flow to Equity holders”
method. Our value for all the 5 BOT projects comes to `105/share, which is 19%
January 23, 2015
9
Initiating coverage | MBL Infrastructure
of the overall SOTP value for the company. Ongoing projects contribute 3% and
under-development projects contribute 16% to the overall value.
On combining the value of EPC business BOT projects, we arrive at a combined
business value of `561/share, reflecting 27% upside in the stock price from the
current levels. In order words, the stock’s current market price reflects the business
value of just the standalone entity. We sense that as and when announcements of
the remaining
4 BOT projects are made, the stock price would catch-up
accordingly. We initiate coverage on MBL with a target price of `561/ share.
Exhibit 14: Sum-of-the-Parts based Valuation Table
FY17E Std. PAT
Target Value
Value/ share
Particulars
Segment
Target Multiple
% of SoTP Basis
(` cr)
(` cr)
(`)
MBL's EPC business
Construction
118
8.0
945
456
81
P/E of 8.0x
Total
945
456
81
Discounted FCFE
Adj. FCFE Value
Value/ share
Particulars
Proj. Type
Project Stake
% of SoTP Basis
(` cr)
(` cr)
(`)
Road BOT projects
Seoni-Balaghat-Rajegaon
Toll
31
100%
31
15
3
Ke of 17%
BOT Project
Waraseoni-Lalbarra BOT Project Toll + Annuity
22
100%
22
11
2
Ke of 17%
Garra-Waraseoni BOT Project Toll + Annuity
17
100%
17
8
1
Ke of 17%
Seoni-Katangi BOT Project
Toll
74
100%
74
36
6
Ke of 17%
Suratgarh-Bikaner BOT Project
Toll
114
65%
74
35
6
Ke of 17%
Total
258
218
105
19
Grand Total
1,162
561
100
Upside
27%
CMP
442
Source: Company, Angel Research
Key risks
Promoters have pledged ~5% of their equity stake (Promoters hold 46% stake
in MBL Infra). Any further increase in the pledge by the promoters could lead
to volatility in the stock price.
Suratgarh-Bikaner BOT project currently accounts for ~20% of unexecuted
order book. Any further delays in getting clearances could impact our near-
term execution assumptions, as well as equity IRRs.
Lower than expected order inflows due to slowdown in new project award
activity
Slower growth vs. our traffic growth expectations is potential risk to toll
revenues from BOT projects.
January 23, 2015
10
Initiating coverage | MBL Infrastructure
Exhibits
Exhibit 15: Order Book split- Vertical-wise
Exhibit 16: Order Book split- State-wise
5.8%
11.7%
6.0%
18.3%
7.2%
3.9%
24.9%
17.5%
54.8%
10.7%
11.1%
5.5%
22.6%
Roads & Highway Cons. Railway Infra
Building & Housing
Haryana
Assam
New Delhi
Uttarakhan
Other Infra
Roads & Highway O&M
West Bengal
Rajasthan
Madhya Pradesh Others
Source: Company, Angel Research
Source: Company, Angel Research
Exhibit 17: Order Book split- Client-wise
Exhibit 18: Consol. Revenue (` cr)
35
3,500
10.7%
20.8%
3,000
30
30
9.5%
2,500
25
23
6.1%
2,000
20
19
5.8%
1,500
15
15
22.6%
1,000
10
500
5
24.6%
0
0
PWD Uttarakhand WBHDCL
NHAI
PWD Haryana
Others
PWD Rajasthan
MPRDC
FY13
FY14
FY15E
FY16E
FY17E
Revenues (` cr)
y/y change (%)
Source: Company, Angel Research
Source: Company, Angel Research
Exhibit 19: Consol. EBITDA (` cr)
Exhibit 20: Consol. PAT (` cr)
500
45
120
40
42
450
40
36
35
39
100
400
35
30
350
31
30
80
25
300
22
25
20
250
60
17
20
15
200
13
15
40
10
150
10
5
100
20
50
5
-
(2)
0
0
0
(5)
FY13
FY14
FY15E
FY16E
FY17E
FY13
FY14
FY15E
FY16E
FY17E
EBITDA (` cr)
y/y change (%)
PAT (` cr)
y/y change (%)
Source: Company, Angel Research
Source: Company, Angel Research
January 23, 2015
11
Initiating coverage | MBL Infrastructure
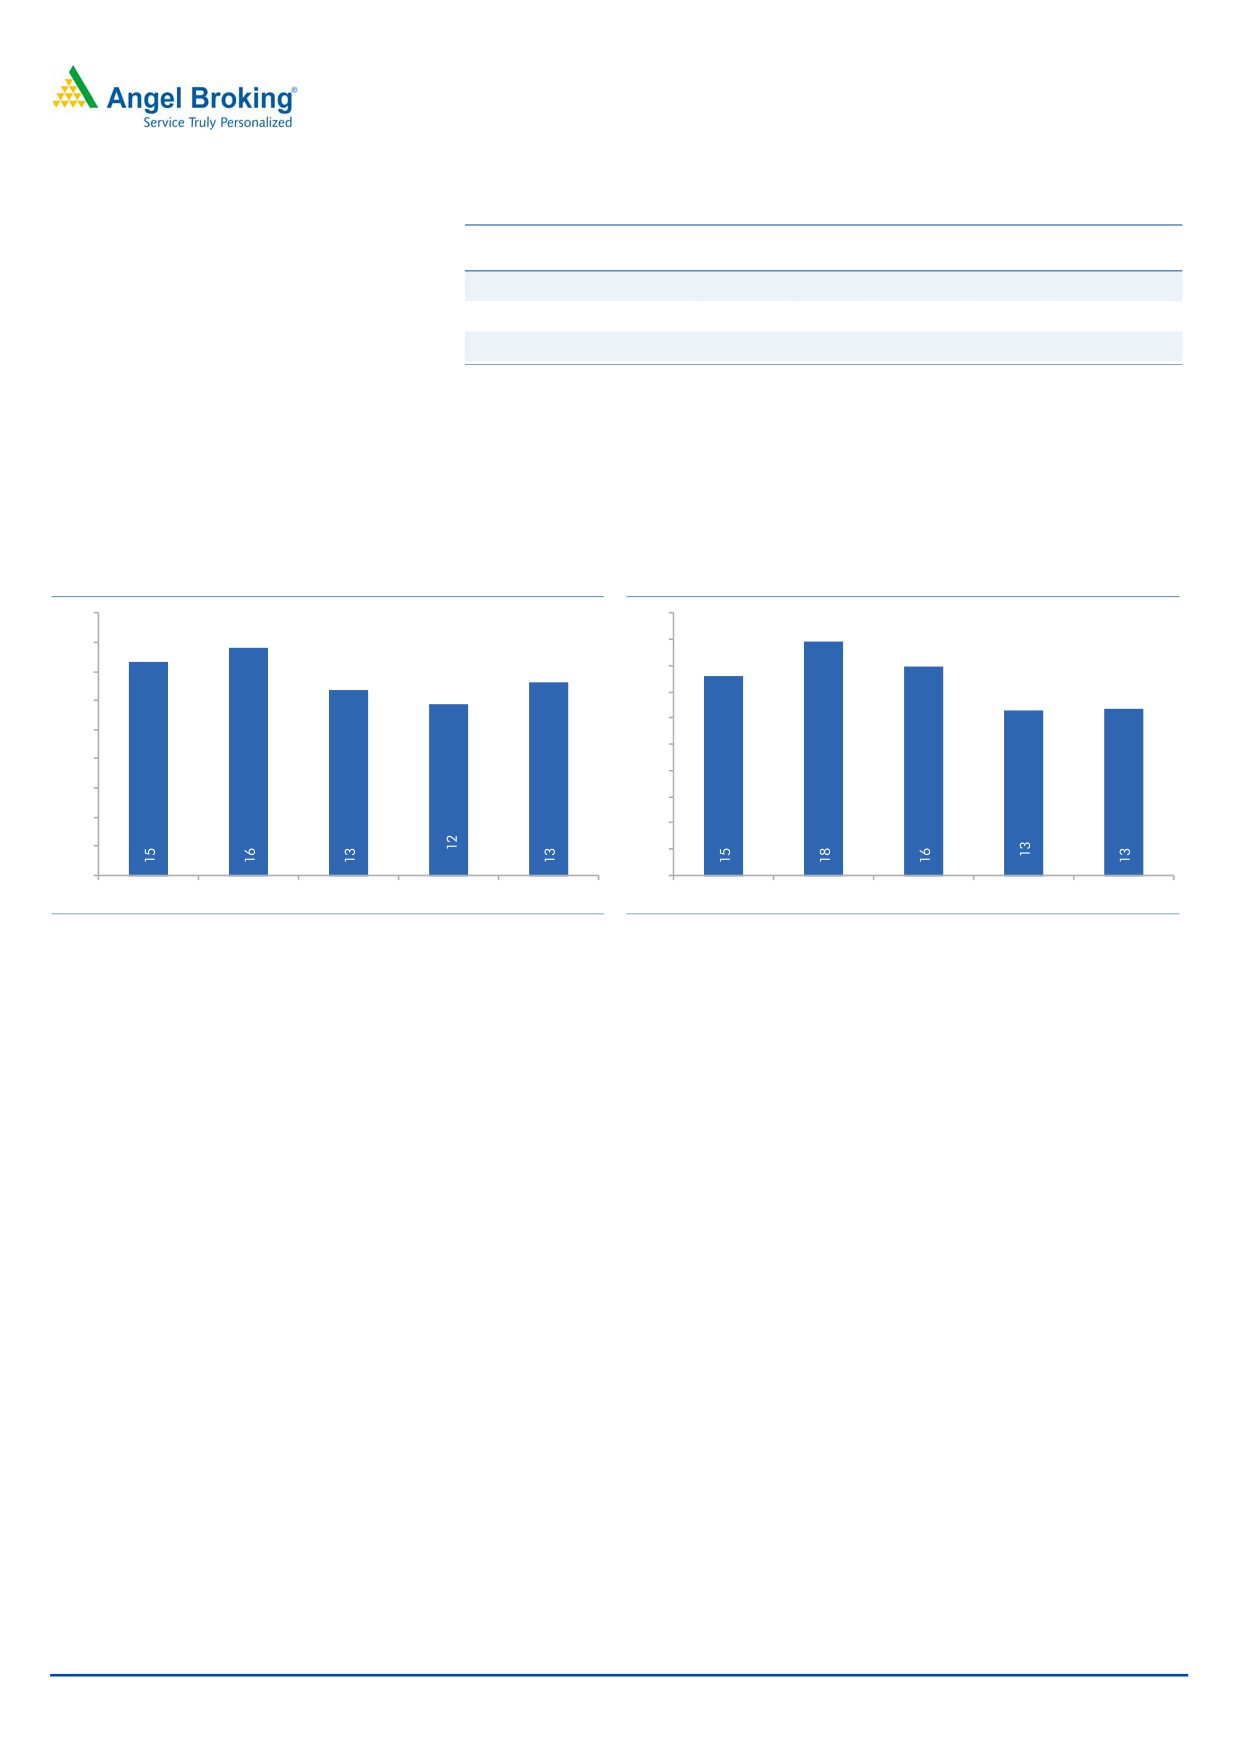
Exhibit 21: Standalone Return on Equity (%)
Exhibit 22: Standalone Return on Capital Employed (%)
20
20
18
20
16
19
14
19
12
18
10
18
8
17
6
17
4
16
2
16
0
15
FY13
FY14
FY15E
FY16E
FY17E
FY13
FY14
FY15E
FY16E
FY17E
Source: Company, Angel Research
Source: Company, Angel Research
January 23, 2015
12
Initiating coverage | MBL Infrastructure
Exhibit 23: List of Ongoing projects
Contract Value
Unexecuted Value
Project details
(` in cr)
(` in cr)
Development & Operation on BOT basis of Bikaner-Suratgarh of NH-15
510
411
Widening to 4-lane of Dankuni-Chandanagar section of SH-13
318
275
Improve & strengthening of roads under Package no. C-4 in Almora dist.
217
217
Construction of Seoni-Katangi BOT Road project
177
21
RCD Contract, ADB funded project for improvement/ upgradation of roads & bridges of SH-68
169
37
(Shivganj-Rafiganj- Uphara-Devkund-Baidrabad)
NHAI contract to widen-strengthen NH-37 stretch of Sonapur-Guwahati (51% JV with TCIL)
158
40
Improve & strengthen roads under Package no. C-2 in Udham singh Nagar dist.
143
143
Construction of Garra-WaraSeoni BOT Road project
110
59
Construct buildings at National Law University, Rajiv Gandhi Education City, Sonepat Dist.
92
91
Construct depot-cum-workshop at Kalindi-kunj (Line-8 for Delhi MRTS Phase III)
84
56
Construct 222 flats, Keelandev Towers at Shivaji Nagar, Bhopal, MP
63
48
Construct Bus Terminus at GT Road, Serampore Municipality, Hooghly, WB
55
39
Re-development of Police Colony, Delhi Cantt.
50
47
Construction of Residential Buildings for NHAI staff at Dwarka, N-Delhi
49
19
Construction of WaraSeoni-Lalbarra BOT Road project
47
6
Construct Assam Judicial Academy & National Law School at Amingaon, Assam
44
32
Construct 4-lane RoB at Delhi Ambala line in Sonepat, Haryana
43
20
Construct Police Residence Quarters at Kindli Check Post, Delhi
41
19
Construct 96 flats at Tulsi Nagar, Bhopal
40
32
Construct 2-lane RoB at Delhi Ambala Railway line of Sonepat-Purkhas Road, Sonepat, Haryana
36
27
Construct Group Housing Residential Apartments for NBCC on Delhi Saharanpur Highway, Baghpat, UP
35
1
Construct 92 flats at Mahadev Parisar, & Construct Commercial Building at Shivaji Nagar, Bhopal
24
7
Construct 2-lane RoB at Delhi Ambala Railway line of Delhi-Ambala, Sonepat, Haryana
23
1
Construct Panchayat & Rural Development Dept. Building at Sector-19 in Naya Raipur
19
17
Construct Police Station & Residences at Hari Nagar, New Delhi
19
10
Construct Residential Accommodation for Senior Officers of SPA, Bhopal
13
11
O&M of Garra-Waraseoni Road project
38
38
O&M of Waraseoni-Lalbarra Road project
15
15
O&M of Seoni-Katangi Road project
263
263
O&M of Suratgarh-Bikaner Road project
251
251
O&M of Seoni-Balaghat Gondia Road, MP
51
49
Residential Complex for Judicial staff at Sec-19, Dwarka, Delhi
46
46
Other Contracts
85
8
Total Gross Order Book
3,327
2,354
Source: Company, Angel Research
January 23, 2015
13
Initiating coverage | MBL Infrastructure
Income Statement (Standalone)
Y/E March (` cr)
FY13
FY14
FY15E
FY16E
FY17E
Net Sales
1,343
1,754
2,019
2,453
2,857
% Chg
30.6
15.1
21.5
16.5
Total Expenditure
1,211
1,578
1,807
2,186
2,539
Cost of Materials Consumed
954
1,376
1,587
1,921
2,237
Direct Labour, Sub-Contracts
180
118
125
150
173
Employee benefits Expense
23
27
30
39
44
Other Expenses
55
57
65
76
86
EBITDA
131
176
212
267
317
% Chg
34.0
20.3
26.1
18.7
EBIDTA %
9.8
10.0
10.5
10.9
11.1
Depreciation
7
10
15
19
21
EBIT
124
166
197
249
296
% Chg
33.9
18.3
26.4
19.0
Interest and Financial
51
70
84
115
139
Charges
Other Income
1
4
2
3
3
PBT
74
101
115
136
160
Tax
19
26
30
35
42
% of PBT
25.4
25.4
26.0
26.0
26.0
PAT before Exceptional item
55
75
85
100
118
Exceptional item
0
0
0
0
0
PAT
55
75
85
100
118
% Chg
35.8
12.9
18.4
17.6
PAT %
4.1
4.3
4.2
4.1
4.1
Diluted EPS
32
43
41
48
57
% Chg
35.8
(4.6)
18.4
17.6
January 23, 2015
14
Initiating coverage | MBL Infrastructure
Balance Sheet (Standalone)
Y/E March (` cr)
FY13
FY14
FY15E
FY16E
FY17E
Sources of Funds
Equity Capital
18
18
21
21
21
Reserves Total
374
443
633
725
833
Networth
391
460
654
746
854
Total Debt
446
463
695
955
1,080
Other Long-term Liabilities
108
153
199
199
199
Deferred Tax Liability
30
34
35
35
35
Total Liabilities
974
1,111
1,582
1,934
2,167
Application of Funds
Gross Block
175
214
279
324
364
Accumulated Depreciation
38
48
63
81
102
Net Block
137
166
216
243
261
Capital WIP
0
0
0
0
0
Investments
98
166
220
308
308
Current Assets
Inventories
491
559
729
872
984
Sundry Debtors
302
374
544
640
730
Cash and Bank Balance
18
13
18
51
98
Loans, Advances & Deposits
71
97
90
89
95
Other Current Asset
4
6
39
46
48
Current Liabilities
285
324
365
405
447
Net Current Assets
601
725
1,056
1,294
1,508
Other Assets
139
53
90
90
90
Total Assets
974
1,111
1,582
1,934
2,167
January 23, 2015
15
Initiating coverage | MBL Infrastructure
Cash Flow Statement (Standalone)
Y/E March (` cr)
FY13
FY14
FY15E
FY16E
FY17E
Profit before tax
74
101
115
136
160
Depreciation
7
10
15
19
21
Change in Working Capital
(80)
(3)
(308)
(205)
(168)
Interest & Financial Charges
51
70
84
115
139
Direct taxes paid
(47)
(14)
(30)
(35)
(42)
Cash Flow from Operations
5
163
(125)
30
111
(Inc)/ Dec in Fixed Assets
(33)
(39)
(65)
(45)
(40)
(Inc)/ Dec in Investments
(26)
(68)
(54)
(88)
-
Cash Flow from Investing
(59)
(107)
(119)
(133)
(40)
Issue/ (Buy Back) of Equity
-
-
117
-
-
Inc./ (Dec.) in Loans
109
18
232
260
125
Dividend Paid (Incl. Tax)
(3)
(6)
(9)
(9)
(10)
Interest Expenses
(51)
(70)
(84)
(115)
(139)
Cash Flow from Financing
55
(58)
256
136
(24)
Inc./(Dec.) in Cash
1
(3)
13
33
46
Opening Cash balances
7
8
6
18
51
Closing Cash balances
8
6
18
51
98
January 23, 2015
16
Initiating coverage | MBL Infrastructure
Key Ratio (Standalone)
Y/E March
FY13
FY14
FY15E
FY16E
FY17E
Valuation Ratio (x)
P/E (on FDEPS)
14.0
10.3
10.8
9.1
7.8
P/CEPS
12.4
9.1
9.2
7.7
6.6
Dividend yield (%)
0.7
0.7
0.8
0.8
0.9
EV/Sales
0.9
0.7
0.8
0.7
0.7
EV/EBITDA
9.2
7.0
7.5
6.8
6.0
EV / Total Assets
1.2
1.1
1.0
0.9
0.9
Per Share Data (`)
EPS (fully diluted)
31.6
42.9
40.9
48.5
57.0
Cash EPS
35.7
48.5
48.3
57.5
67.3
DPS
3.0
3.0
3.7
3.5
4.2
Book Value
224
263
315
360
412
Returns (%)
RoCE (Pre-tax)
16.6
19.3
17.5
16.5
16.5
Angel RoIC (Pre-tax)
15.0
18.4
14.7
14.8
15.5
RoE
15.1
17.6
15.2
14.4
14.8
Turnover ratios (x)
Asset Turnover (Gross Block) (X)
0.8
0.9
0.9
0.9
0.9
Inventory / Sales (days)
134
109
116
119
119
Receivables (days)
82
70
83
88
88
Payables (days)
28
27
25
22
20
Leverage Ratios (x)
D/E ratio (x)
1.1
1.0
1.1
1.3
1.3
Interest Coverage Ratio (x)
2.4
2.4
2.4
2.2
2.1
January 23, 2015
17
Initiating coverage | MBL Infrastructure
Income Statement (Consolidated)
Y/E March (` cr)
FY13
FY14
FY15E
FY16E
FY17E
Net Sales
1,355
1,766
2,038
2,507
2,986
% Chg
30.3
15.4
23.0
19.1
Total Expenditure
1,212
1,578
1,809
2,196
2,557
Cost of Materials Consumed
954
1,376
1,587
1,921
2,237
Direct Labour, Sub-Contracts
180
118
125
150
173
Employee benefits Expense
23
27
30
39
44
Other Expenses
55
57
67
87
103
EBITDA
143
188
229
311
429
% Chg
31.2
21.6
35.8
38.1
EBIDTA %
10.6
10.7
11.2
12.4
14.4
Depreciation
11
14
21
34
57
EBIT
132
174
208
277
372
% Chg
31.6
19.4
33.3
34.3
Interest and Financial Charges
58
75
89
155
246
Other Income
2
4
2
3
3
PBT
76
103
121
125
129
Tax
20
26
31
36
44
% of PBT
25.7
25.2
25.3
29.2
33.9
PAT before Exceptional item
57
77
90
88
85
Exceptional item
0
0
0
0
0
PAT before Minority Interest
57
77
90
88
85
Minority Interest
0
0
0
0
(14)
PAT after Minority Interest
57
77
90
88
99
% Chg
35.9
17.1
(1.9)
12.2
PAT %
4.2
4.4
4.4
3.5
3.3
Diluted EPS
32
44
43
43
41
% Chg
36.0
(1.1)
(1.9)
(3.8)
January 23, 2015
18
Initiating coverage | MBL Infrastructure
Balance Sheet (Consolidated)
Y/E March (` cr)
FY13
FY14
FY15E
FY16E
FY17E
Sources of Funds
Equity Capital
18
18
21
21
21
Reserves Total
380
451
642
722
797
Networth
398
469
663
742
817
Total Debt
644
772
1,391
1,955
2,183
Other Long-term Liabilities
44
40
73
73
73
Minority Interest
0
32
32
32
18
Deferred Tax Liability
30
34
35
35
35
Total Liabilities
1,116
1,347
2,193
2,837
3,126
Application of Funds
Gross Block
248
287
352
841
1,583
Accumulated Depreciation
59
73
91
121
183
Net Block
189
214
261
720
1,400
Capital WIP
209
376
715
620
0
Investments
20
20
24
24
24
Current Assets
Inventories
491
559
729
872
984
Sundry Debtors
253
318
594
731
829
Cash and Bank Balance
77
68
15
50
102
Loans, Advances & Deposits
72
98
90
89
95
Other Current Asset
6
8
39
46
48
Current Liabilities
208
330
365
405
447
Net Current Assets
692
721
1,103
1,382
1,612
Other Assets
6
16
90
90
90
Total Assets
1,116
1,347
2,193
2,837
3,126
January 23, 2015
19
Initiating coverage | MBL Infrastructure
Cash Flow Statement (Consolidated)
Y/E March (` cr)
FY13
FY14
FY15E
FY16E
FY17E
Profit before tax
76
103
121
125
129
Depreciation
11
14
21
34
57
Change in Working Capital
(35)
(56)
(472)
(248)
(172)
Interest & Financial Charges
58
75
89
155
246
Direct taxes paid
(48)
(14)
(31)
(36)
(44)
Cash Flow from Operations
62
122
(272)
28
216
(Inc)/ Dec in Fixed Assets
(172)
(206)
(404)
(394)
(121)
(Inc)/ Dec in Investments
(20)
-
(4)
-
-
Cash Flow from Investing
(191)
(206)
(409)
(394)
(121)
Issue/ (Buy Back) of Equity
-
-
117
-
-
Inc./ (Dec.) in Loans
202
128
619
564
228
Dividend Paid (Incl. Tax)
(3)
(6)
(9)
(9)
(10)
Interest Expenses
(58)
(75)
(89)
(155)
(246)
Minority Interest
0
32
-
-
(14)
Cash Flow from Financing
142
78
638
401
(42)
Inc./(Dec.) in Cash
13
(6)
(42)
35
53
Opening Cash balances
50
63
57
15
50
Closing Cash balances
63
57
15
50
102
January 23, 2015
20
Initiating coverage | MBL Infrastructure
Key Ratio (Consolidated)
Y/E March
FY13
FY14
FY15E
FY16E
FY17E
Valuation Ratio (x)
P/E (on FDEPS)
13.7
10.1
10.2
10.4
10.8
P/CEPS
11.5
8.5
8.3
7.5
5.9
Dividend yield (%)
0.7
0.7
0.8
0.8
0.9
EV/Sales
1.0
0.8
1.1
1.1
1.0
EV/EBITDA
9.4
7.9
10.0
9.1
7.0
EV / Total Assets
1.2
1.1
1.0
1.0
1.0
Per Share Data (`)
EPS (fully diluted)
32.3
44.0
43.5
42.7
41.0
Cash EPS
38.7
52.0
53.6
58.9
75.3
DPS
3.0
3.0
3.7
3.5
4.2
Book Value
227.1
267.6
319.7
358.2
394.4
Returns (%)
RoCE (Pre-tax)
14.6
15.6
12.7
11.8
13.2
Angel RoIC (Pre-tax)
12.9
14.4
10.2
10.4
12.5
RoE
15.2
17.8
15.9
12.6
12.7
Turnover ratios (x)
Asset Turnover (Gross Block) (X)
0.6
0.7
0.7
0.5
0.4
Inventory / Sales (days)
127
108
115
117
113
Receivables (days)
57
59
82
97
95
Payables (days)
18
25
24
21
19
Leverage Ratios (x)
D/E ratio (x)
1.6
1.6
2.1
2.6
2.7
Interest Coverage Ratio (x)
2.3
2.4
2.4
1.8
1.5
January 23, 2015
21
Initiating coverage | MBL Infrastructure
Research Team Tel: 022 - 39357800
DISCLAIMER
This document is solely for the personal information of the recipient, and must not be singularly used as the basis of any investment
decision. Nothing in this document should be construed as investment or financial advice. Each recipient of this document should
make such investigations as they deem necessary to arrive at an independent evaluation of an investment in the securities of the
companies referred to in this document (including the merits and risks involved), and should consult their own advisors to determine
the merits and risks of such an investment.
Angel Broking Pvt. Limited, its affiliates, directors, its proprietary trading and investment businesses may, from time to time, make
investment decisions that are inconsistent with or contradictory to the recommendations expressed herein. The views contained in this
document are those of the analyst, and the company may or may not subscribe to all the views expressed within.
Reports based on technical and derivative analysis center on studying charts of a stock's price movement, outstanding positions and
trading volume, as opposed to focusing on a company's fundamentals and, as such, may not match with a report on a company's
fundamentals.
The information in this document has been printed on the basis of publicly available information, internal data and other reliable
sources believed to be true, but we do not represent that it is accurate or complete and it should not be relied on as such, as this
document is for general guidance only. Angel Broking Pvt. Limited or any of its affiliates/ group companies shall not be in any way
responsible for any loss or damage that may arise to any person from any inadvertent error in the information contained in this report.
Angel Broking Pvt. Limited has not independently verified all the information contained within this document. Accordingly, we cannot
testify, nor make any representation or warranty, express or implied, to the accuracy, contents or data contained within this document.
While Angel Broking Pvt. Limited endeavours to update on a reasonable basis the information discussed in this material, there may be
regulatory, compliance, or other reasons that prevent us from doing so.
This document is being supplied to you solely for your information, and its contents, information or data may not be reproduced,
redistributed or passed on, directly or indirectly.
Angel Broking Pvt. Limited and its affiliates may seek to provide or have engaged in providing corporate finance, investment banking
or other advisory services in a merger or specific transaction to the companies referred to in this report, as on the date of this report or
in the past.
Neither Angel Broking Pvt. Limited, nor its directors, employees or affiliates shall be liable for any loss or damage that may arise from
or in connection with the use of this information.
Note: Please refer to the important `Stock Holding Disclosure' report on the Angel website (Research Section). Also, please refer to the
latest update on respective stocks for the disclosure status in respect of those stocks. Angel Broking Pvt. Limited and its affiliates may
have investment positions in the stocks recommended in this report.
Disclosure of Interest Statement
MBL Infrastructure
1. Analyst ownership of the stock
No
2. Angel and its Group companies ownership of the stock
No
3. Angel and its Group companies' Directors ownership of the stock
No
4. Broking relationship with company covered
No
Note: We have not considered any Exposure below ` 1 lakh for Angel, its Group companies and Directors
Ratings (Returns):
Buy (> 15%)
Accumulate (5% to 15%)
Neutral (-5 to 5%)
Reduce (-5% to -15%)
Sell (< -15%)
January 23, 2015
22
Initiating coverage | MBL Infrastructure
6th Floor, Ackruti Star, Central Road, MIDC, Andheri (E), Mumbai- 400 093. Tel: (022) 39357800
Research Team
Fundamental:
Sarabjit Kour Nangra
VP-Research, Pharmaceutical
Vaibhav Agrawal
VP-Research (Banking)
Amarjeet Maurya
Analyst (FMCG, Media, Mid-Cap)
Bharat Gianani
Analyst (Automobile)
Rahul Dholam
Analyst (Metal, Oil & Gas)
Santosh Yellapu
Analyst (Infrastructure)
Shrenik Gujrathi
Analyst (Cap Goods, Cement)
Umesh Matkar
Analyst (Banking)
Twinkle Gosar
Analyst (Mid-Cap)
Tejas Vahalia
Research Editor
Technicals and Derivatives:
Siddarth Bhamre
Head - Technical & Derivatives
Sameet Chavan
Technical Analyst
Sneha Seth
Associate (Derivatives)
Institutional Sales Team:
Mayuresh Joshi
VP - Institutional Sales
Meenakshi Chavan
Dealer
Gaurang Tisani
Assistant Manager
Production Team:
Dilip Patel
Production Incharge
CSO & Registered Office: G-1, Ackruti Trade Centre, Road No. 7, MIDC, Andheri (E), Mumbai - 93. Tel: (022) 3083 7700. Angel Broking Pvt. Ltd: BSE Cash: INB010996539 / BSE F&O: INF010996539, CDSL Regn. No.: IN - DP - CDSL - 234 - 2004, PMS Regn. Code: PM/INP000001546, NSE Cash: INB231279838 /
NSE F&O: INF231279838 / NSE Currency: INE231279838, MCX Stock Exchange Ltd: INE261279838 / Member ID: 10500. Angel Commodities Broking (P) Ltd.: MCX Member ID: 12685 / FMC Regn. No.: MCX / TCM / CORP / 0037 NCDEX: Member ID 00220 / FMC Regn. No.: NCDEX / TCM / CORP / 0302.
January 23, 2015
23